

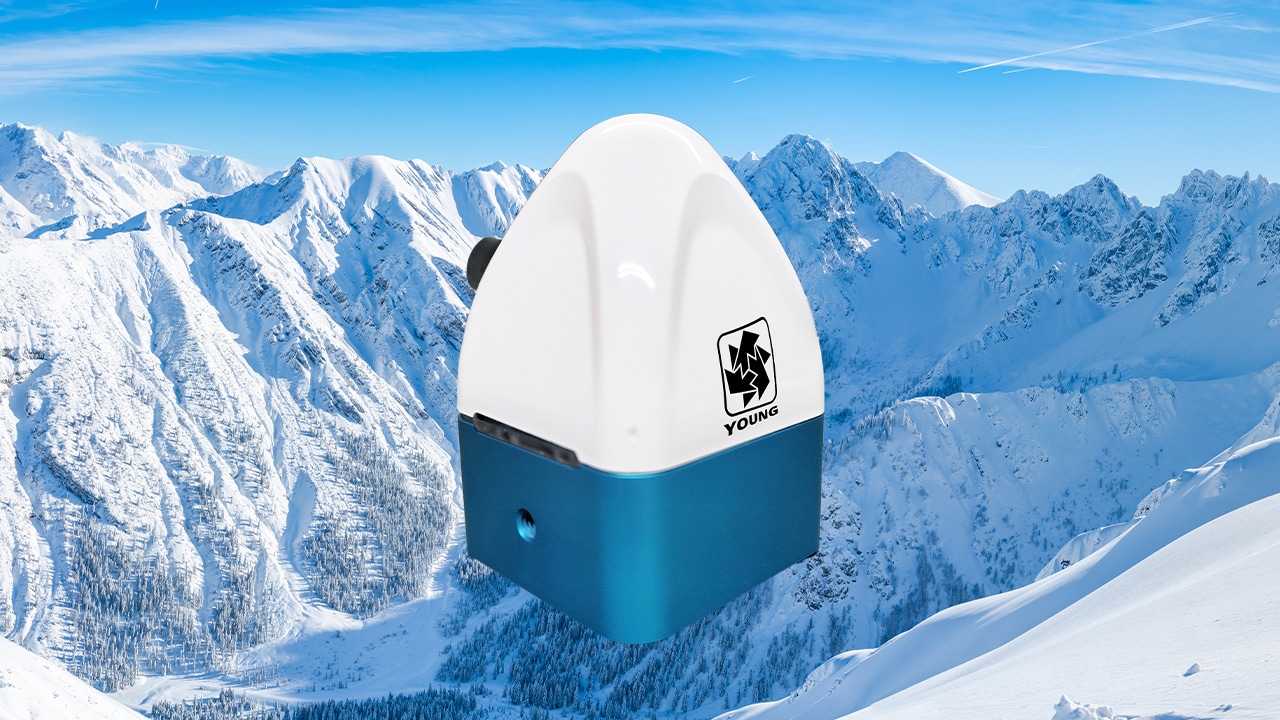
Getting Started with SNOdar
Quick Setup Guide, FAQs, and More Information About the SNOdar
Whether you’re a new SNOdar user looking for installation instructions, a veteran with an operation question, or doing your research before committing to the SNOdar, you found the right place!
To start, let’s skip to the stuff that matters to you: What best describes you?
⏵ I'm here to learn about SNOdar
Why SNOdar
About the SNOdar
The SNOdar is renowned for its accurate and robust monitoring of snow depth and new snowfall, even during winter storm events. It is one of the only snow depth sensors that utilizes LIDAR (Light Detection and Ranging) technology to provide accurate snow depth measurements. This high-precision method allows the SNOdar to create detailed, real-time snow depth data, ensuring reliable and efficient snow monitoring for a variety of applications. For added convenience, the SNOdar mobile app allows quick configuration, real-time monitoring via Bluetooth, and easy data downloads directly to your device.
Features:
Real-time, accurate snow depth information during storms and heavy snowfall (NO postprocessing necessary).
Bluetooth Low Energy (BLE) enabled configuration, installation, and live display
Seasonal internal data logger
Seasonal snowfall totals
Seasonal snow depth and new snowfall, even during heavy snowfall
Optional add-on estimated Snow Water Equivalent (SWE)
SDI-12 data logger and RS-232 output
Sensor orientation monitoring (e.g. high snow load, high wind, tower shifting)
Includes mounting clamp and 10-meter cable
Low power deployment, ≤ 500 mW average consumption
Normal or oblique angle mounting (up to 30 degrees) for flexible mounting locations on inclines or stormboards
Applications:
SNOTEL Snow Depth Monitoring
Stormboard Snowfall Measurement
Avalanche Monitoring and Forecasting
DOT Road Conditions Monitoring
Cornice Growth
Ski Resort Snow Monitoring
General Snow Management
Features
Electrical Interfaces
Wired:
The communication standards accessible on cable allow for rapid deployment with commercial off-the-shelf (COTS) telemetry devices.
(1) RS-232 port (common among commercial LTE modems)
(1) SDI-12 port (common among remote sensors and commercial data loggers)
Wireless:
Bluetooth Low Energy (BLE) 5.x
2 Mbps PHY capable, up to 50 meters Line-of-Sight (LOS)
Long Range 125 Kbps PHY, up to 250 meters LOS
The wireless connection allows for quick setup and calibration, data monitoring and sharing.
Technical
Specifications
Input Voltage:
Input voltage range (VDC):
Min: 6V
Max:24V
Operating Temperature:
Outside, ambient operating temperature range:
Min: -40°C
Max: 60°C
Storage Temperature:
Inside, ambient storage temperature range:
Min: -40°C
Max: 85°C
Mechanical Vibration:
20g MIL-STD-883D
Mechanical Shock
500g MIL-STD-883D
Ingress Protection:
Dust tight. Immersion, up to 1 meter depth :: IP67
Corrosion Resistance:
Type II: MIL-A-8625
Accuracy
±1 cm to 2 m
±2 cm to 4 m
±4 cm to 8 m
Resolution:
1 cm
Range:
Distance from snow target:
Min: 0.09 meters
Max: 9 meters
Measurement Interval:
1 minute granularity:
Min: 1 minutes
Max: 60 minutes
Power Consumption:
Max measured with heater ON;
Min: 0.42 watts
Max: 3.2 watts
Current Consumption:
@ 12 VDC, with Heater OFF (Idle, Active):
Min: 0.04 amps
Max: 3.24 amps
Average Power:
Typical average seasonal power usage: 0.5 watts
Weight:
Without mounting clamp: 265 grams
With mounting clamp: 375 grams
Size: 6.3 x 6.3 x 9.5 cm
ESD Ratings:
Human-Body Model: ±2500V
Charged-Device Model: ±1000V
Certifications
Regulatory Compliance & Certs
Full Compliance:
EMC
• FCC 15B and ISES-003 Issue 7
• CISPR 32:2015 / CENELEC EN 55032:2015
• CISPR 35:2016 / CENELEC EN 55035:2017
• ETSI EN 301 489-1 v2.2.3:2019
• ETSI EN 301 489-17 v3.1.1:2020
IP67
• IEC 60529 Section 13.4, 13.6
• IEC 60529 Section 14.2.7
Safety
• IEC 61010-1:2010
• IEC 61010-1:2010/AMD1:2016
RoHS
Features
Accessories
Cable:
The cable that ships with the SNOdar has a straight overmolded connector.
Rated -40°C to 105°C
Wire Gauge: 20 AWG
Blunt cut for connection flexibility
Power Rating: 300V
UL Recognized, CSA Certified and RoHS Compliant
IP67 Connector (Outer Jacket is UV and Water Resistant)
Length: 10 meters
Mounting Clamp:
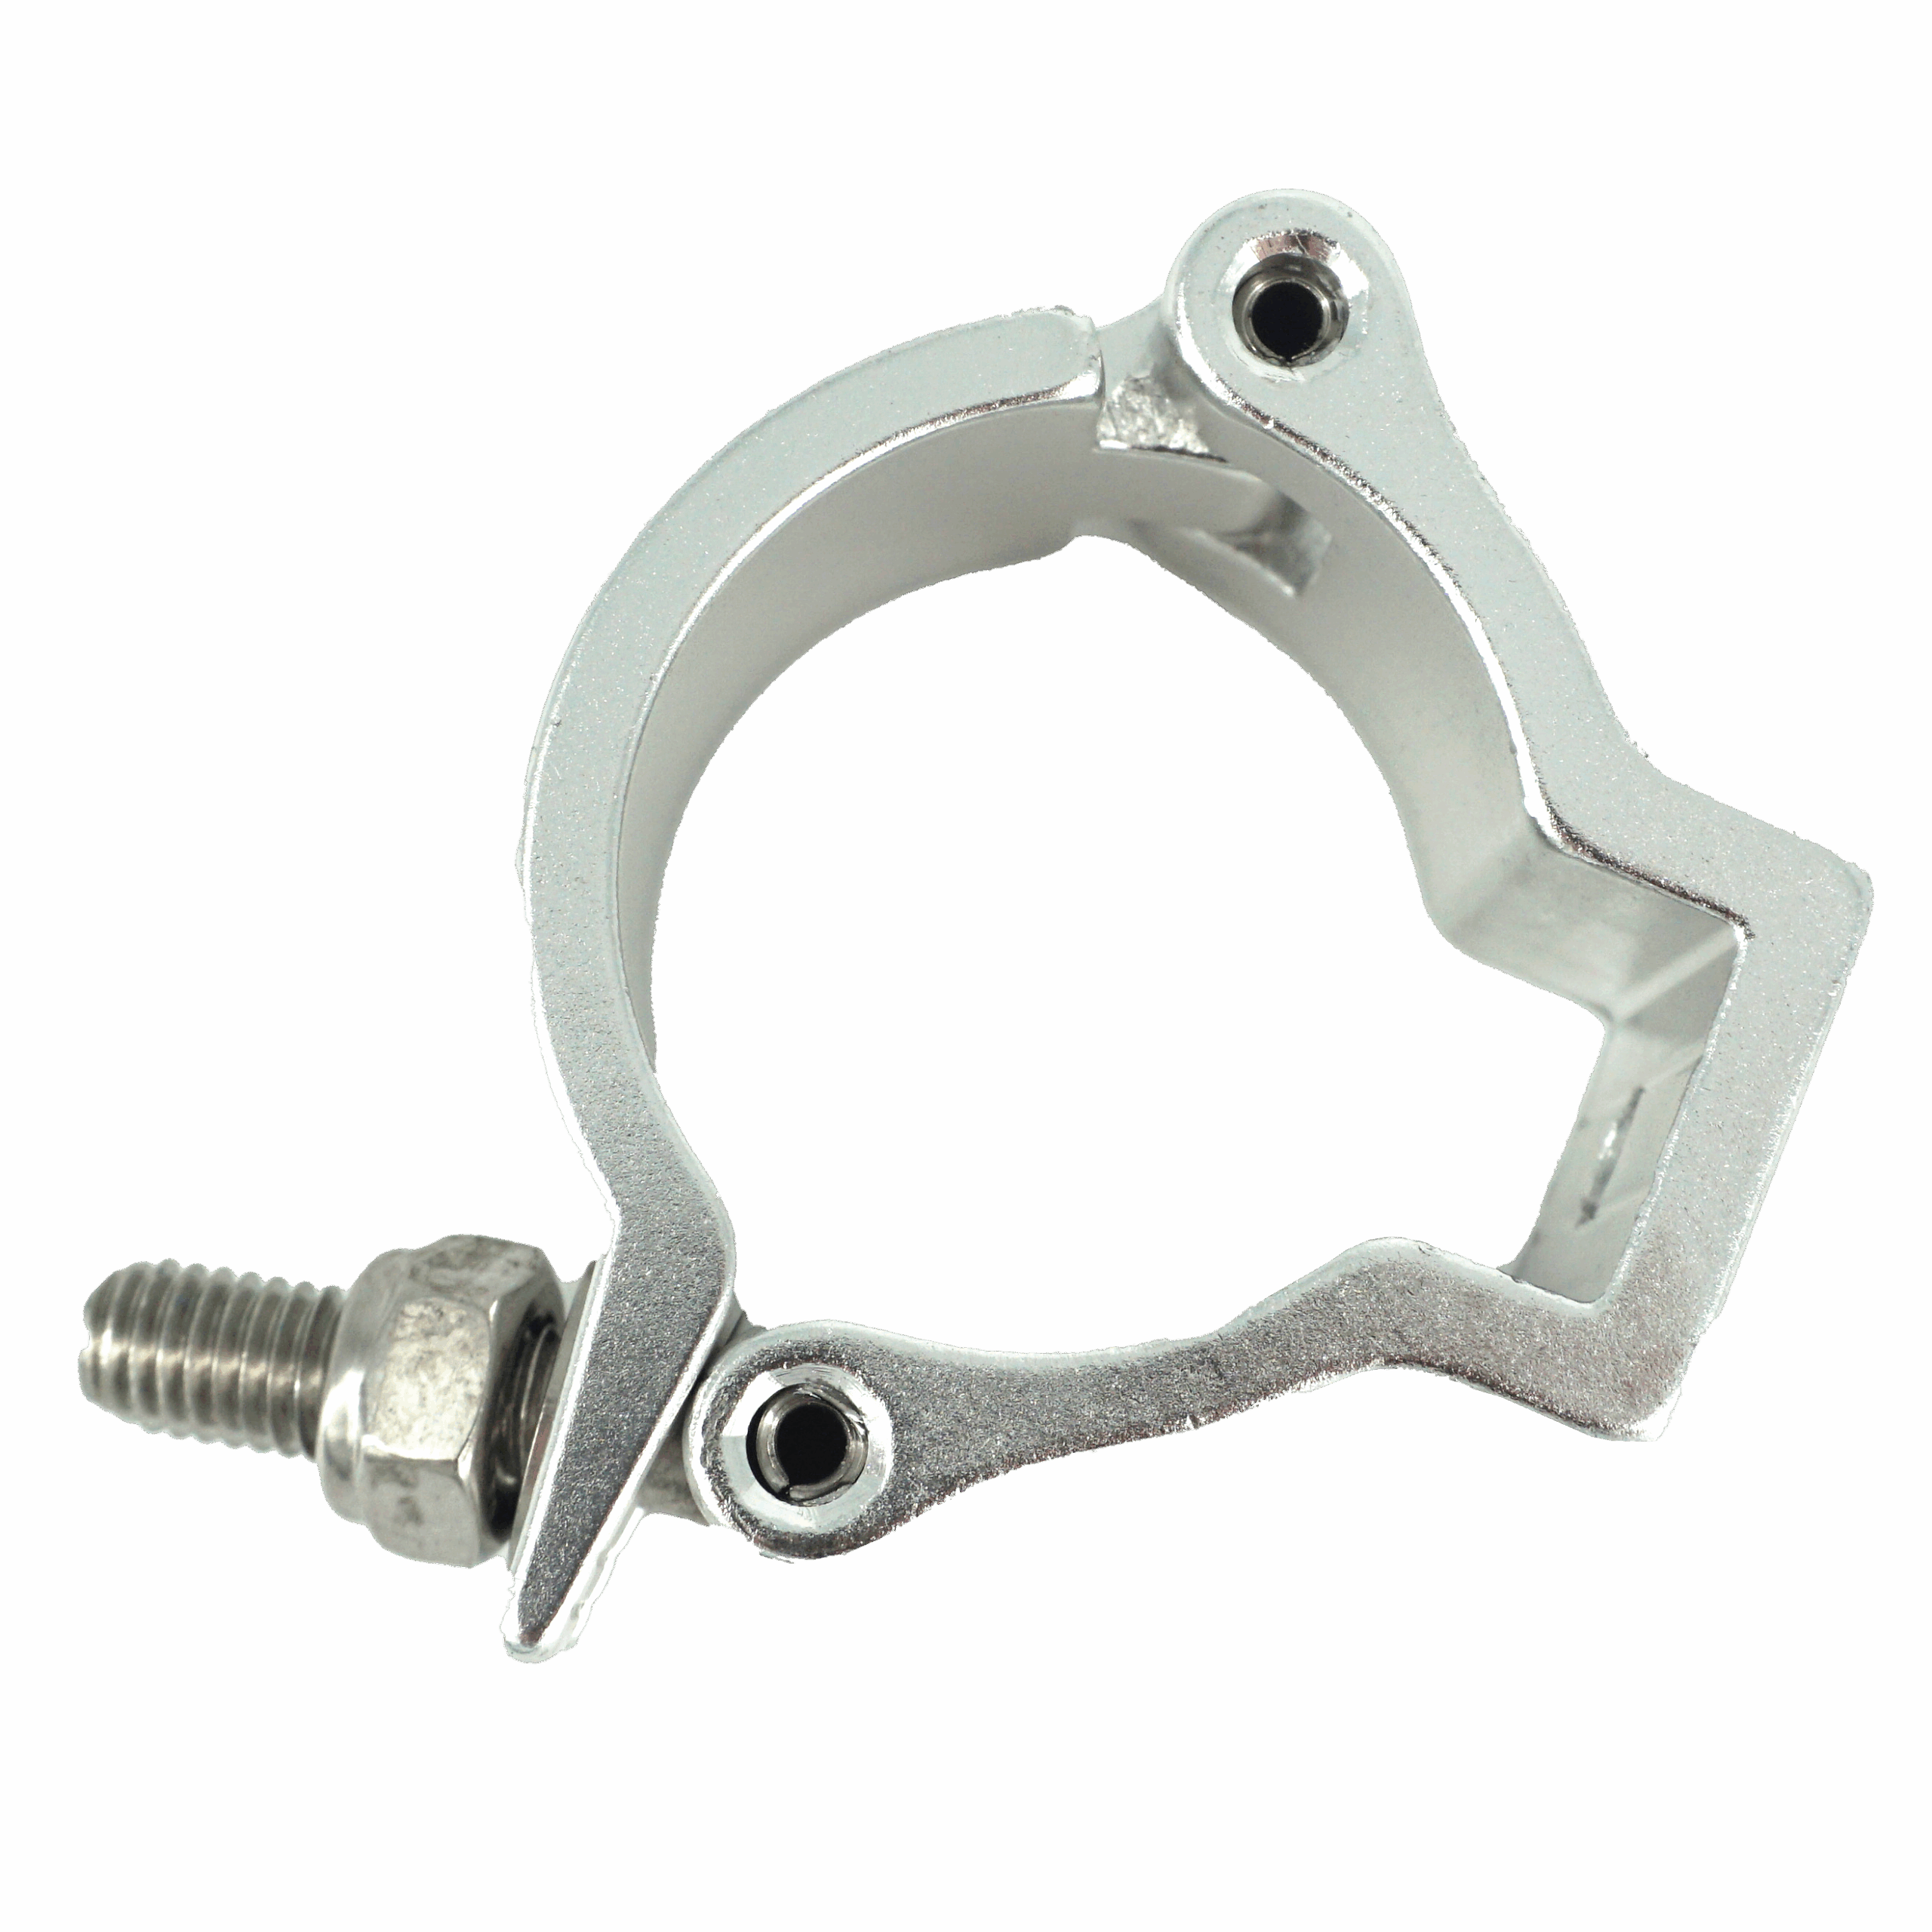
The clamp that ships with the SNOdar is aluminum 6061-T6 with 304-stainless steel hardware and accommodates a pipe OD of 1.49-1.58”. Please contact SLI if a different size clamp is required.
Medium duty clamp for 1.5” OD Tube
Minimum Tube Size: 38mm
Maximum Tube Size: 40mm
Maximum Load Capacity: 100kg/220lbs
Get Started
Quick Setup Guide
Power & Boot Sensor
Unbox the device and locate the 6-pin power cable. Apply the supplied grease to the connector on the device prior to connecting the cable. Ensure proper alignment with the directional key, and secure the connection by engaging the bayonet locking mechanism.
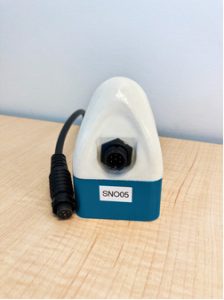
Supply a power input of 6–24 VDC (min of 3.5 W) to the cable leads.
| SNOdar Pin Name | SNOdar Pin No. | Cable Pin No. | Wire Color |
| GND | 1 | 1 | BLACK |
| +12 to 24VDC | 2 | 2 | WHITE |
Note: The wiring used for communication depends on whether the sensor is operated using RS-232 or SDI-12. Refer to the appropriate interface section later in this manual for detailed wiring diagrams.
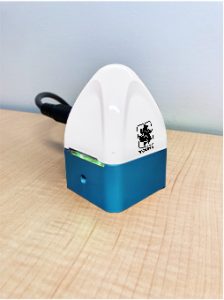
Once the device is powered on, the green LED will flash 20 times at 5 Hz, indicating the sensor has booted successfully and is actively broadcasting a Bluetooth Low Energy (BLE) signal.
If installing in the field, proceed to Installation and Mounting. Otherwise, set the sensor aside and install the SNOdar mobile application.
Installation & Mounting
MOUNTING HEIGHT
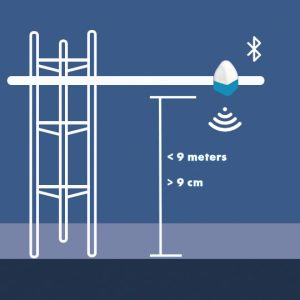
Mount the sensor less than 9 meters from the ground and more than 9 cm from the ground or Stormboard fixture.
Field-of-View:
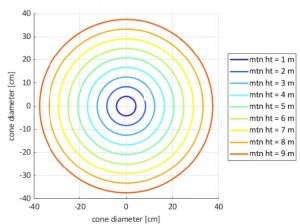
The approximate cone projection field-of-view (FOV) of the SNOdar is shown in the diagram below. This visualization indicates the size and shape of the measurement zone on the ground or snowpack, offering guidance for proper mounting height and clearance.
SNOdar Field of View: Mounting Ht vs. Cone of Influence
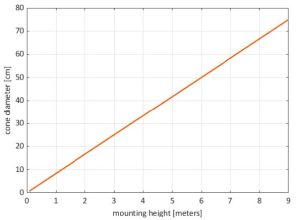
SNOdar Field of View: Mounting Ht vs. Cone of Influence
OBLIQUENESS
For best performance, when mounting the sensor, rotate it so that it is normal to the ground, i.e. measuring perpendicular to the ground surface; however, it does have the ability to be mounted at angles or on hillsides, up to 30 degrees from normal. Note that if mounted at an angle, max mounting height will be reduced.
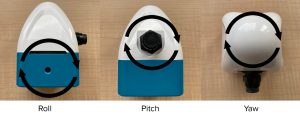
IMU DIRECTIONALITY
- Roll: Rotation about the axis running through the clamp mount (this is the rotation monitored in Stormboard mode, 20 degrees is ideal)
- Pitch: Rotation about the axis running through the connector
- Yaw: Rotation about the axis running through the top dome peak
GROUND PREPARATION
Before setup and calibration, ensure the area beneath the sensor is free of any debris, such as sticks, rocks, or uneven ground clumps. Additionally, remove any large foliage or tall grass surrounding the sensor. For optimal accuracy in seasonal measurements, it is recommended to prepare a level dirt pad beneath the sensor.
Electrical Interfaces
The SNOdar Snow Depth Sensor provides both wired and wireless communication interfaces to support a wide range of deployment scenarios. These options allow for rapid integration with commercial off-the-shelf (COTS) telemetry equipment, as well as convenient wireless access for setup, configuration, anddata monitoring.Mount the sensor less than 9 meters from he ground and more than 9 cm from the ground or Stormboard fixture.
WIRED INTERFACES
The SNOdar sensor includes industry-standard wired communication ports to ensure compatibility with common data acquisition systems:
- RS-232: A standard serial interface widely used among commercial Satcom and LTE modem platforms. This connection supports straightforward integration in remote monitoring installations.
- SDI-12: A low-power digital interface commonly used by environmental sensors and commercial data loggers. SDI-12 enables seamless integration into existing hydrological, meteorological, and environmental monitoring networks.
WIRELESS INTERFACES
In addition to wired communication, the SNOdar sensor includes a robust Bluetooth® Low Energy (BLE) 5.x wireless interface for convenient local access:
- 2 Mbps PHY: Supports high-speed communication at distances up to 50 meters line-of-sight (LOS).
- Long-Range 125 Kbps PHY: Provides extended connectivity up to 250 meters LOS.
- The wireless interface enables quick and efficient setup, calibration, data monitoring, and data sharing using compatible mobile devices without the need for direct cable connection.
RS-232
The SNOdar includes a dedicated RS-232 port for direct serial communication with commercial Satcom/LTE modems and other data acquisition devices. This interface provides full diagnostic information, system temperatures, inertial sensor data, and all calculated snow-related measurements in a single serial output string.
Connect power and RS-232 signal wires through the 6-pin connector as shown below.
| SNOdar Pin Name | SNOdar Pin No. | Cable Pin No. | Wire Color |
| GND | 1 | 1 | Black |
| +12-24 VDC | 2 | 2 | White |
| TX: RS-232 | 5 | 5 | Blue |
| RX: RS-232 | 6 | 6 | Violet |
SERIAL PORT SETTINGS
The SNOdar RS-232 interface operates using the following fixed communication parameters (configured in firmware):
• Baud Rate: 19200
• Data Bits: 8
• Parity: None (N)
• Stop Bits: 1
• Hardware Flow Control: Disabled / None
• Timeout: 10 ms
Ensure your logging or telemetry device is configured with these settings to properly receive serial output.
DATA OUTPUT
Each RS-232 transmission contains a sequence of data fields describing device status, internal temperatures, inertial sensor readings, and real-time snow depth measurements. The table below defines each field within the serial output string:
| Field # | Name | Units | Comments |
| 1 | unix_time | Seconds | |
| 2 | power_current | mA | |
| 3 | power_voltage | Volts | |
| 4 | soc_temp | Deg C | |
| 5 | pcb_temp | Deg C | |
| 6 | imu_temp | Deg C | Inertial sensor temperature |
| 7 | imu_q0 | Radians | Inertial sensor |
| 8 | imu_qx | Radians | Inertial sensor roll axis rotation |
| 9 | imu_qy | Radians | Inertial sensor pitch axis rotation |
| 10 | imu_qz | Radians | Inertial sensor yaw axis rotation |
| 11 | snodar_soc_temp | Deg C | Internal temperature |
| 12 | snodar_pcb_temp | Deg C | Internal Temperature |
| 13 | snodar_tc_distance | In. or m | Calibration distance |
| 14 | heater_en | Heater | On or Off |
| 15 | outside_temp | Deg C | -1 means no temperature sensor in use |
| 16 | current_snow_depth | In. or m | The height of the current snow pack |
| 17 | seasonal_snow_fall | In. or m | The sum of each daily snow fall |
| 18 | daily_snow_fall | In. or m | The 24 hour snowfall based on the “daily reset time” |
| 19 | doy_swe | In. or m | The estimated SWE value eSWE |
| 20 | snodar_temp_swe | Deg C | -1 means no temperature sensor in use |
SDI-12
The SNOdar Model 54000 supports communication using the SDI-12 v1.4 protocol. This section provides an overview of the commands and data returned by the sensor. For full protocol details, refer to the official SDI-12 Specification.
Connect power and the SDI-12 data line through the 6-pin connector as shown below.
| SNOdar Pin Name | SNOdar Pin No. | Cable Pin No. | Wire Color |
| GND | 1 | 1 | Black |
| +12-24 VDC | 2 | 2 | White |
| SDI-12 | 4 | 4 | Red |
MEASUREMENT DATA AND OVERVIEW
Each measurement sequence returns 9 data values, in the order shown below. Measurement units (meters or inches) depend on the device configuration.
Sensor Data
1. System Current (mA)
2. System Voltage (V)
3. Internal Temperature (°C)
4. Orientation Flag (see description below)
5. Distance (m or in)
DSP – Processed Data
6. Seasonal Snow Depth (m or in)
7. Seasonal Snowfall (m or in)
8. Daily New Snowfall (m or in)
9. Day-of-Year SWE (m or in)
START MEASUREMENT
To initiate a measurement, send the following SDI-12 command: aM!
After receiving the aM! command, the sensor immediately responds with: atttn!<CR><LF>
Where :
• a = sensor address
• ttt = time in seconds required to complete the measurement
• n = number of data values available (n is always 9, corresponding to the nine data values listed in Measurement
Data Overview)
Example Response: 00109<CR><LF>
This response indicates that 9 data values will be available in
10 seconds.
Measurement duration depends on the physical installation and
operating conditions of the SNOdar.
• The default initial measurement time is 30 seconds.
• After each completed measurement, the sensor automatically
updates the reported measurement time to the actual
measured duration, rounded to the nearest second plus one
additional second.
• If the measurement completes earlier than the reported
time, the sensor issues a service request to indicate that
data is ready.
RETRIEVE MEASUREMENT DATA
Once the measurement is complete, retrieve the data using the
D commands.
Because SDI-12 messages have a limited length, the SNOdar
returns its 9 data values across two data requests:
aD0!
aD1!
Example Data Retrieval
First data request: aD0!
Response: 0+46.700+11.072+27.938+0.000+1.487<CR><LF>
This response contains 5 data values. To retrieve the remaining
values, issue a second data request.
Second data request: aD1!
Response: 0+0.027+1.320+0.047+0.007<CR><LF>
Data Output Definitions
46.700 System current (mA)
11.072 System voltage (V)
27.938 System temperature (°C)
0 Orientation flag
1.487 Distance measurement (m)
0.027 Seasonal snow depth (m)
1.320 Seasonal snowfall (m)
0.047 Daily new snowfall (m)
0.007 Day-of-year Snow Water Equivalent (SWE) (m)
| Name | Command | Response |
| Address Query | ?! | a<CR><LF> |
| Acknowledge Active | a! | a<CR><LF> |
| Change Address | aAb! a = Sensor address b = New sensor address |
b<CR><LF> |
| Send Identification | al! | a14RMYOUNG 54000 1202P0210504<CR><LF> |
Send Identification, where:
a = sensor address
14 = SDI-12 compatibility number
RMYOUNG = company name
54000 = sensor model number
120 = firmware version
2P0 = hardware version
210504 = serial number
Orientation Flag Description
The Orientation Flag reports whether the sensor’s current pitch
and roll angles differ from the orientation used during setup
calibration. A value of 0 indicates normal operation with no
significant orientation change.
The flag is a bit-encoded integer, where each bit corresponds to
a threshold being exceeded. Each bit has an associated value
that contributes to the final Orientation Flag number.
Bit Definitions
| Bit | Value | Condition |
| 0 | 1 | Δ pitch > 5° |
| 1 | 2 | Δ pitch > 20° |
| 2 | 4 | Δ roll > 5° |
| 3 | 8 | Δ roll > 20° |
ACCUMULATION RULE
The Orientation Flag value is formed by adding together the values of all bits whose conditions are met. Because the threshold
levels are hierarchical, exceeding a larger threshold automatically includes the smaller one.
For pitch, if Δ pitch > 20°, then both pitch thresholds are exceeded:
• Bit 0 (value 1) for Δ pitch > 5°
• Bit 1 (value 2) for Δ pitch > 20°
So the pitch contribution becomes: 1 + 2 = 3
For roll, if Δ roll > 20°, then both roll thresholds are exceeded:
• Bit 2 (value 4) for Δ roll > 5°
• Bit 3 (value 8) for Δ roll > 20°
So the roll contribution becomes: 4 + 8 = 12
Example: Δ pitch > 5° and Δ roll > 20°
Δ pitch > 5° → Bit 0 set (value 1)
Δ roll > 20° → Bits 2 and 3 set (values 4 + 8 = 12)
Total Orientation Flag value: 1 + 12 = 13
Download The App
Download the app on the mobile device of your choice:


Run The App
PERMISSIONS
To run the fully featured App, Bluetooth and Location services (i.e. GPS) MUST be enabled.
CONNECT
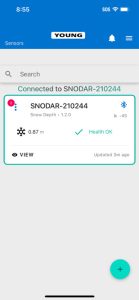
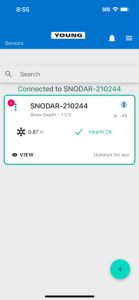
- To connect to a sensor, tap the + sign in the lower right corner of the screen.
- From the Add Sensor screen, connect to the desired sensor by tapping on the Connect button by the sensor’s name.
- When prompted, enter the default passkey `123456` and tap the pair button.
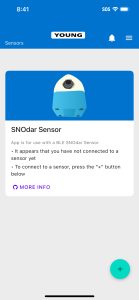
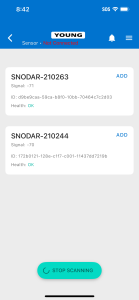
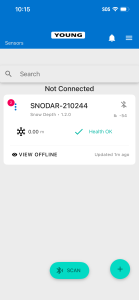
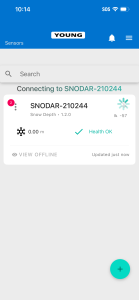
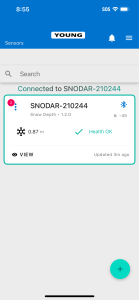
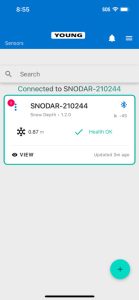
- Devices that have already been added will be listed on the home screen and can be connected to by tapping the Bluetooth button to the right of the device’s name
PAIRING & BONDING SECURITY
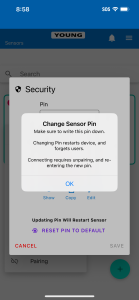
The mobile device will now have to pair and bond to the SNOdar device. This is an encryption-based security feature to protect the device and its data from nefarious and/or unintentional actions. Therefore, it is highly important to change the default passkey and note, somewhere safe, where it can be recalled if forgotten.
CHANGE PASSKEY
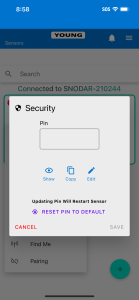
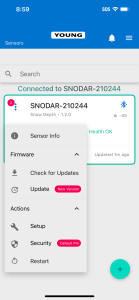
- From the home screen, tap on the Kebab Menu beside the name of the desired sensor.
- Select Security from the menu items.
- Tap the edit button and change the default passkey to a six digit, numeric passkey of your choice.
- Tap the Save button to update the passkey.
NOTE: Updating the passkey will restart the device.
Sensor Setup
Upon SNOdar sensor field installation, it is imperative to run the Sensor Setup located in the Kebab Menu on the home screen.
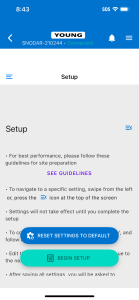
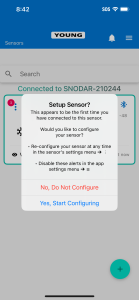
SENSOR MODE
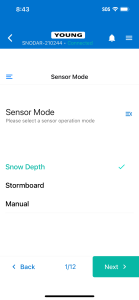
The Sensor Mode Page allows for different sensor operation modes to be selected.
- The Snow Depth sensor mode is standard automated snow depth measurement. The unit needs to be calibrated at the beginning of each season (preferably when NO snow is present) for accurate, settled snow depth measurements.
- The Stormboard sensor mode is a manual calibration mode for storm snowfall measurements. This mode will calibrate to ‘zero’ accumulation after the user wipes the stormboard clean of snow. A manual calibrate after each clear will help the accuracy remain high.
- The Distance sensor mode is used for basic distance measurements. This will be the default mode when NO Bluetooth setup can be done. The sensor will measure distance to the snow every 5 minutes and send data out the SDI-12.
- The Manual sensor mode has no automated operation only user interactions. This mode is used exclusively for testing and in lab scenarios.
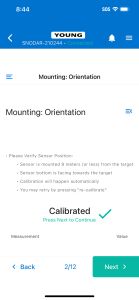
MOUNTING: ORIENTATION
The Mounting Orientation page verifies that the sensor is mounted in the proper orientation—less than 9 meters above ground and with the sensor bottom facing towards the ground.
Once the sensor has been mounted, press the Calibrate button in the bottom middle of the screen. If the sensor is properly oriented, this Calibrate button will turn green.
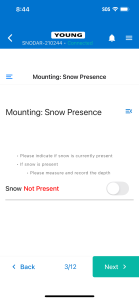
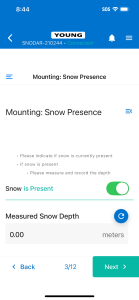
MOUNTING: SNOW PRESENCE
The Snow Presence Page records if snow is present when sensor is set up. If snow is present, the depth of the snow in meters must be entered.
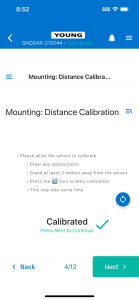
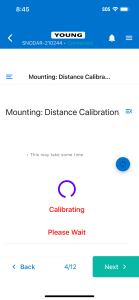
MOUNTING: DISTANCE CALIBRATION
The Sensor Calibration Page allows the sensor to calibrate. To do so, clear any obstruction from below the sensor, press the Calibrate button, and stand at least 10 meters away from the sensor.
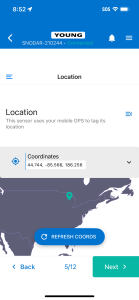
LOCATION
The Location Page uses your mobile device’s GPS to determine the sensor’s location. To update the location tap the Refresh Coords button.
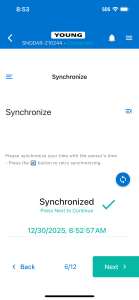
SYNCHRONIZE
The Synchronize Page synchronizes the sensor’s time with the time and time zone of your mobile device. To do so, press the Synchronize button. When the time has been synchronized, the newly set time will be displayed.
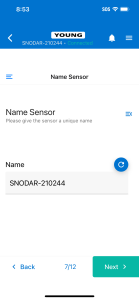
NAME SENSOR
The Name Sensor Page allows for the sensor to be given a unique name. The name can be reverted back to the original sensor name by pressing the Refresh icon to the right of the text input field.
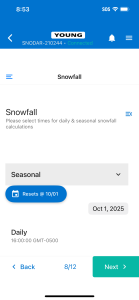
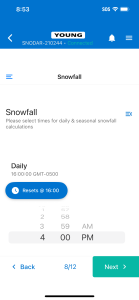
SNOWFALL
The Snowfall page allows for a time to be set at which the snowfall calculations for the day and the season will start over. To set the seasonal reset date, tap the date icon under the Resets @ button and scroll through the year, month, and date. To set the daily reset time, scroll through the time options under the Resets @ button. Both values are set according to the local time of the mobile device.
SNOW CLASS
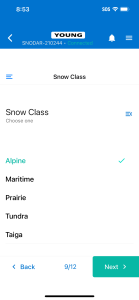
The Snow Class Page allows for the type of snow to be specified. Choose a snow class that best describes the snow in your region:
- Alpine
- Maritime
- Prairie
- Tundra
- Taiga
MEASUREMENT INTERVAL
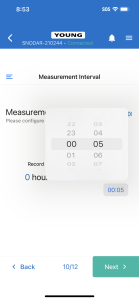
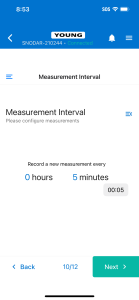
The Measurement Interval Page allows for the interval at which measurements are taken to be set. The minimum allowable time interval is 1 minute.
To set the interval, tap anywhere on the current hours and minutes listing. Then tap the time button that appears. To increase the time, drag the hours (left) or minutes (right) up. To decrease the time, drag the hours (left) or minutes (right) down. Tap anywhere outside of the time input to exit.
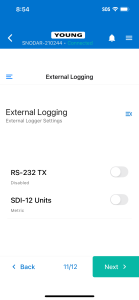
EXTERNAL LOGGING
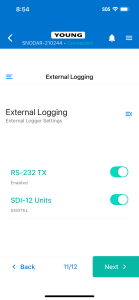
The logging mode for data acquisition can be set to a combination of RS-232 TX, RS-232 Format, and SDI-12 Units. RS-232 TX must be enabled in order to enable SDI-12 Units.
ENHANCED TEMPERATURE CONTROL
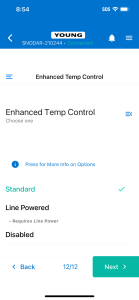
While the SNOdar has a standard temperature control, the Enhance Temperature Control page allows for the temperature control to be disabled or set to Line Powered control. Detailed information about each of these options can be found by tapping the more info button.
COMPLETE SETUP
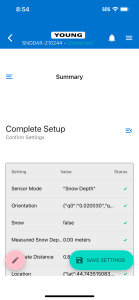
Lastly, the Complete Setup Page provides a summary of the settings. Any setup steps that were skipped or are incomplete will have a red x next to them. To go back to these steps, press the menu button in the right corner of the setup page and choose the desired setup step from the menu.
To confirm the settings and complete the sensor setup, press the Save Settings button.
ERASE DATA FLASH
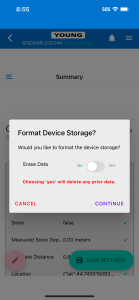
Once you press the Save Settings button, you will be asked if you would like to format the device storage. By choosing yes the device storage will be formatted and any recorded data will be deleted. By choosing no, the device storage will not be formatted and any recorded data will be preserved.
View
To view a sensor and its associated data, press the View button on the desired sensor’s tab. You can return to the home page via the back arrow in the top left corner.
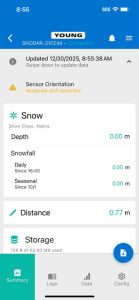
SUMMARY
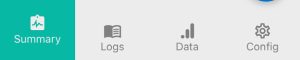
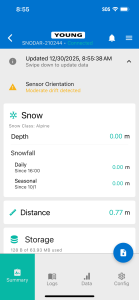
The Summary Page provides an overview of the sensor’s data as well as displays any errors with the sensor. For more information on sensor error notifications see the Sensor Error Notifications section of the user guide.
The Summary Page contains information on snow depth, sensor storage, measurement information, sensor power, internal sensor temperature including potential heater failure, and sensor orientation including potential sensor drift.
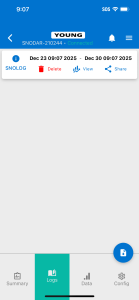
LOGS
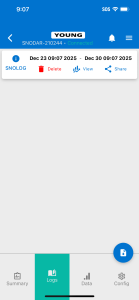
The Logs Page displays data that has been downloaded for the sensor. To download data, press the Download button in the lower right hand corner of the page. Then press the Download Log from Sensor button. You will be prompted to choose data from either the last day, the last week, or the last month. A custom range can also be selected by tapping on the first displayed date or time and setting a unique time then doing the same for the second displayed date or time. Once downloaded, the logs page will display all logs that have been downloaded to your mobile device.
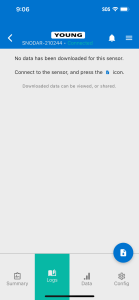
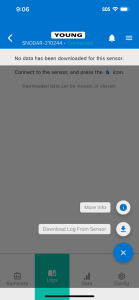
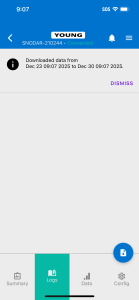
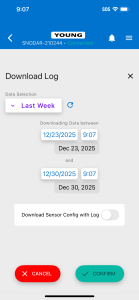
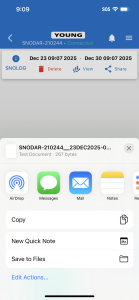
More information about each log can be found under the SNOLOG Information button. To view a graph of the log, tap the View button. Tapping the Share button will bring up options for sharing the log or uploading to your cloud storage of choice.
DATA
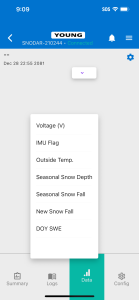
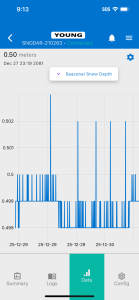
The Data Page displays an interactive depiction of the downloaded data. To plot data, select a log and press the View button for that log. Once the log has been plotted, different collections of data can be displayed by tapping the Dropdown menu above the plot. The chart settings can also be altered by tapping the Settings icon beside the dropdown menu.
CONFIGURATION
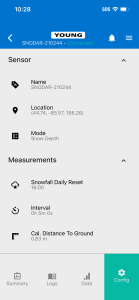
The Config Page allows for quick edits of some of the sensor’s settings. These settings can only be edited after the Unlock button in the bottom corner of the screen is tapped. The Lock button should be tapped after edits are made.
”Appendix”
DEVICE FIRMWARE UPDATE (DFU)
The App has the ability to update the sensor firmware over-the-air (OTA). Toggle the main Kebab menu in the upper left corner of the sensor card on the Home page. If there is an available update, a red-encircled + alert will appear by the Update action. Initiate the update and the unit LEDs will quickly flash Magenta, then hold Cyan while it is updating. DON’T power down the sensor or quit the App while updating. The unit will reboot and flash Green when updated and ready.

LED LEGEND
- Upon Boot
- 4 secs @ 5 Hz Green: Health Diagnostics Passing
- 4 secs @ 5 Hz Red: Health Diagnostics Failure
- Measurement
- Solid Yellow for length of measurement
- Solid White for length of calibration
- BLE Connect
- Fade Blue -> Cyan -> White for 2 seconds
- BLE Disconnect
- Fade White -> Cyan -> Blue for 2 seconds
- Device Firmware Update (DFU) via Mobile device
- Magenta for 2 seconds preparing update into Cyan for the length of the upload, up to 60 seconds. The unit will reboot when updating is finished.
- ‘Find Me’ Feature on the _Home_ Kebab menu
- Blue <-> White ping-pong for 4 seconds
- Useful to identify units when there are multiple sensors
to configure
SENSOR ERROR NOTIFICATIONS
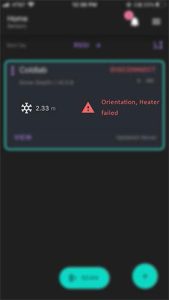
Orientation Drift: This sensor orientation notification will appear if considerable drift has been detected in the sensor’s orientation. This error can be resolved by adjusting the sensor back to the correct orientation.
Heater Failure: This notification will be seen if the sensor’s internal heater fails.
UNDERSTANDING THE MENUS
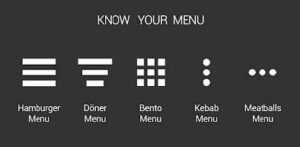
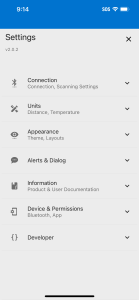
General App Info is contained in the upper right Hamburger Menu.
Questions & Answers
Frequently Asked Questions
What is the accuracy and resolution of SNOdar measurements?
SNOdar provides snow depth measurements with sub centimeter-level resolution and has an accuracy of ±1 cm, depending on mounting height, environmental conditions, and calibration.
What is the recommended mounting height and orientation?
The recommended mounting height depends on the expected maximum snow depth. For typical environments, a height of 8–9 feet (3 m) are ideal. The sensor should be mounted, pointing vertically downward over a stable, snow-accumulating surface free of obstructions or shadows. Maximum height is 10 ft (~9 m).
How does SNOdar perform in drifting snow or high wind conditions?
Our proprietary measurement process allows SNOdar to maintain performance in windy or drifting snow scenarios better than ultrasonic sensors. However, surface irregularities caused by wind can introduce variability. Averaging and filtering functions in the software help smooth out these fluctuations.
Can SNOdar distinguish between snow and other obstructions (like debris or animals)?
While SNOdar is highly accurate, it will measure any surface that reflects energy back to the sensor. Users should mount it over a controlled area to minimize interference from vegetation, wildlife, or debris. The app and firmware include data smoothing and outlier filtering to help manage anomalies.
What data output formats does SNOdar support?
SNOdar supports data retrieval via Bluetooth and output via analog voltage, RS-232, and SDI-12 (depending on model). The data can be integrated into third-party loggers or platforms using standard communication protocols.
Is SNOdar compatible with SCADA or existing weather station software?
Yes. SNOdar’s data output formats can be integrated with SCADA systems or data loggers that support analog, SDI-12, or serial input. It’s designed to be plug-and-play with many environmental monitoring systems.
What maintenance is required throughout the season?
SNOdar is designed to be low-maintenance, but we recommend occasional visual inspections to ensure the lens remains free of obstructions like ice, dirt, or snow build-up. The device has no moving parts, reducing wear and the need for service.
Can SNOdar operate in remote or solar-powered installations?
Yes. With a low power draw, SNOdar is an excellent choice for off-grid or solar-powered sites. Battery-backed or solar installations are common, particularly in remote alpine or arctic research settings.
How is the data stored and how much can it hold?
SNOdar stores an entire season’s worth of timestamped depth data internally (several months, depending on sampling rate). Data can be downloaded via Bluetooth and exported for analysis. There’s no ongoing subscription or cloud storage requirement.
Can the user adjust the measurement interval?
Yes. The measurement interval is user-configurable via the app. Users can set SNOdar to collect data at intervals ranging from once every few seconds to once per hour, depending on power and data storage requirements.
Is there a way to trigger measurements remotely?
Remote triggering is possible via integration with logging equipment or automation systems using the supported digital or serial interfaces.
How does SNOdar estimate Snow Water Equivalent (SWE)?
SWE is estimated by combining snow depth measurements with user-provided snow density data. While SNOdar doesn’t directly measure density, it uses real-time depth data in conjunction with configurable inputs or default regional values to calculate SWE. This provides a helpful approximation for managing water content in snowpacks.